Chart Designer
For chart layout templates a chart designer is available set out how your chart will appear,
Designing your chart
Charts are drawn using numeric values in the fields that are included in the panel (see below for rules on how this is established).
You can rotate the data axes. For example, in a line chart the x axis uses the labels of the numerical fields as categories and the y axis uses the values of the data. If you rotate the data the x axis uses the values of the first non-numerical field as the categories and the y axis uses the numerical values across each row as the values.
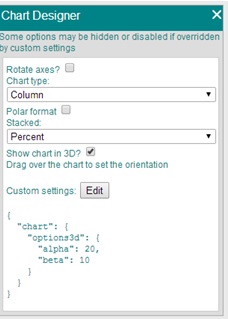
Select the chart type:
• Line (the default)
• Spline
• Column
• Bar
• Area
• Area Spline
• Pie
As you select the chart type, some options will be disabled or removed (for example you can’t have a 3d line chart so the 3d options will be removed).Similarly some chart types are disabled when certain options are selected.
Polar format (for selected chart types) changes the chart from x/y axes to a circular format.
Stacked charts put the value series on top of each other. There are two options: normal and percent. The difference between them is that the percent option takes each value in the series as a percentage of the total.
Some chart types may be displayed in 3d. Check the box to convert to 3d and then, in the panels presentation display, use the mouse to drag the chart around to set the orientation you require.
The options provided are intended to make it easy to create useful charts, However, the chart generator has considerably more options than are used here. The “custom settings” option lets you specify overriding and additional settings. These are applied as well as and (when they coincide with the options available) in preference to the standard options.
The settings must be entered as valid JSON notation with property names and text values surrounded by double quotes.
Please see highcharts.com for more information.
Rules for data used
The data used for the chart is determined from the list of fields available (which you can change).
If the data is used without rotation the category (x axis labels) are from the first non-numeric field. If there are none, the first numeric field is used and excluded from the data fields,
All numeric fields (except the first if used for a category) are included as series data.
If the category field is a date or date/time format field and the chart is of the appropriate type, the x axis is set as a a time line and the data points are placed along it according to their position in the time line.
If data axes are rotated, the first non-numeric field (or first numeric if none is found) is used as the x axis categories. All rows are used with the series values taken “across” the rows.
Note that a pie chart only ever uses one series.

