Introduction
This document provides a step-by-step guide. Concepts and principles are not explained here so you should use this guide in conjunction with our product documents.
It is possible to incorporate a chart representation of table data from your DSD, in your template. The software will automatically perform the MS Word Chart function so that the end user does not have to.
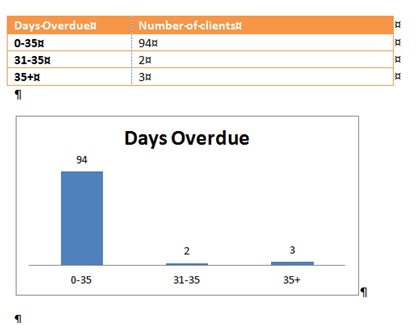
The table of data we are working with in this document represents the overdue client activities. Whilst the report can list the client information and their overdue activities; the chart will represent the summarised statistics
Process
1 Chart Tag in the Designer Tag List
2 Setting out the Table.
3 Tagging the Table.
4 Inserting the Chart.
1 Chart Tag in the Designer Tag List
Create your template is the usual way and notice the special tag called Chart.
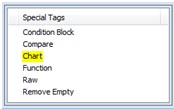
This tag will need to surround the chart and the table that you want to be displayed as a chart. More on how to do this in item 3.
2 Setting out the Table
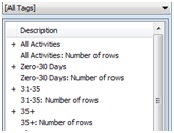
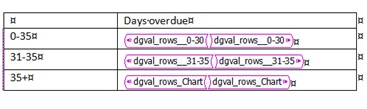
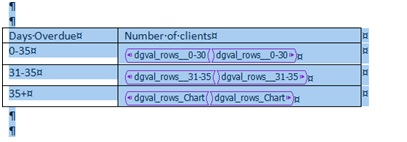
- Create a standard MS Word table and insert the data field tags in the usual way. In the sample below the table and chart will use the Number of rows tags. These tags contain a function which counts the number of records (rows) resulting from the DSD query (these tags are created automatically).Please note that in screenshots below “Show Markers” has been enabled from the fDocs Designer ribbon to show where tags sit within your template.
Note:
- the table must only contain data that can be charted.
- it must have numerical statistics, not a list of text (apart from the headings).
- the type of chart selected is able to represent the table columns, ie a pie chart can only represent one column of data.
There is no need to format the table, unless you choose to leave the table displayed as well as the chart.
2.1 Chart Title
The chart title is picked up in 3 different ways:
- If you leave the chart title unedited, it will default to a category heading, in this example, Number of Clients.
- If you edit the chart title, it will default to the contents of the top left cell, in this example Days Overdue.
This can be useful if you want to use a data field tag in there because you want the output to be variable. - If you edit the chart title and specify a title, you must remove the contents of the top left cell.
3 Tagging the Table
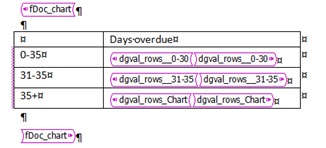
Surround the table with the chart special tag; by selecting the table with 2 line spaces above and below:
And double click on the special tag Chart, so it looks like this:
Now when your cursor is placed inside there are 2 more new special tags:
Chart Data (Remove) – Remove the table in the output and only display the chart
Chart Data (Leave) – Leave the table to display as well as the chart
Decide which tag you want and then this must surround the table also but inside of the Chart tag:

4 Inserting the Chart
With the cursor clicked inside of the chart tag, insert the chart, where desired, by the usual method:
- From the Insert tab on the Word ribbon – click on Chart
- Specify which type of chart you would like to use.
Word will now open a split-pane view of Excel and will display some dummy data which you can ignore- close the Excel pane - A sample chart with the dummy data will now display on your template. You can format and size as required. The final design layout should look similar to this:
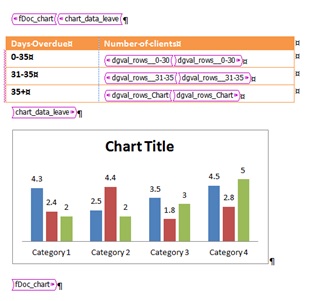
The dummy chart will display in the template but when you preview your output it will automatically use the data from the data field tags in the table: